Simple monitoring with Beszel
What is Beszel#
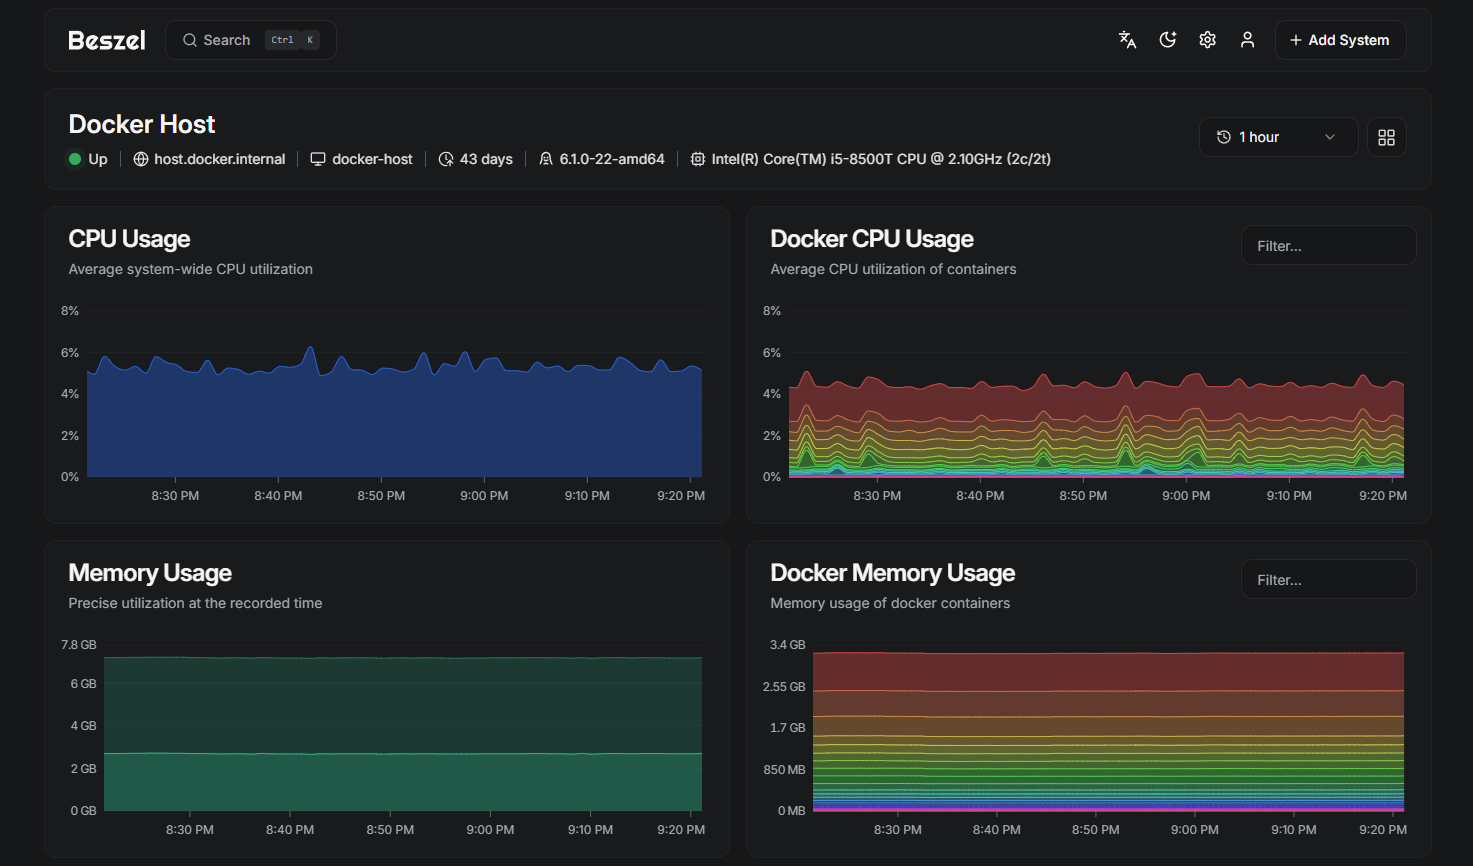
It is a lightweight monitoring platform including docker stats, alerts and a web UI. Take a look at the official documentation HERE
Why not Grafana + Prometheus#
If you already have a Grafana + Prometheus stack, you are not missing out on anything. Beszel is a much simpler and lighter alternatives to Grafana+Prometheus. I personally have a full Prometheus + Grafana stack, but I wanted to give Beszel a try and I found it pretty nice.
If you currently have no monitoring stack, and you want something simple to get started with, I would recommend that you give Beszel a try. And if you find it lacking any features that you want, you can then think about Grafana + Prometheus. And if you would like to give Grafana + Prometheus a try, I have a post Setting up Prometheus and Grafana using Docker
How does it work#
- Two components : Hub and Agents
- Hub is the backend that runs on a docker container.
- The agents runs on each machine we want to monitor. The Hub connects to the agent via ssh
Let’s set it up#
Step 1 : Install the Hub#
Go to the host where you want to run the Hub. And create the docker compose file
mkdir beszel
cd beszel
Create compose.yml with the following content
services:
  beszel:
    image: henrygd/beszel:latest
    container_name: beszel
    restart: unless-stopped
    extra_hosts:
      - host.docker.internal:host-gateway
    ports:
      - 8090:8090
    volumes:
      - ./beszel_data:/beszel_data

  beszel-agent:
    image: henrygd/beszel-agent:latest
    container_name: beszel-agent
    restart: unless-stopped
    network_mode: host
    volumes:
      - /var/run/docker.sock:/var/run/docker.sock:ro
    environment:
      PORT: 45876
      # Do not remove quotes around the key
      KEY: 'UPDATE WITH YOUR PUBLIC KEY (copy from "Add system" dialog)'
Bring it up
docker compose up -d
Step 2 : Setup the Agent#
Now, go to your ip where beszel is running:8090 on a browser, create the admin user
From the “Add new system” dialog, copy the public key
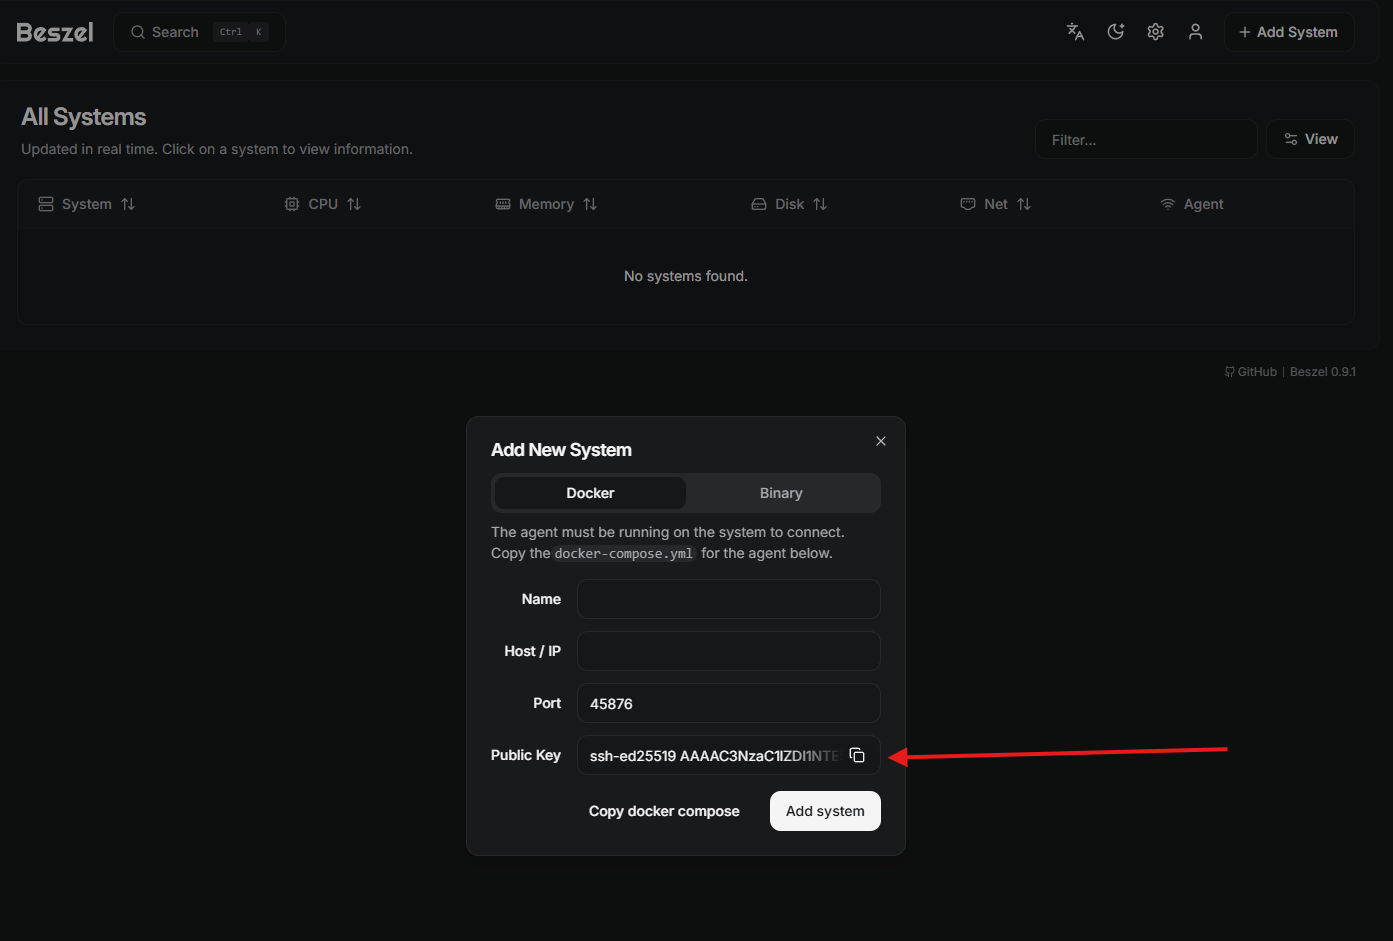
Even though the “hub” and “agent” are running on the same docker stack, it uses ssh to communicate.
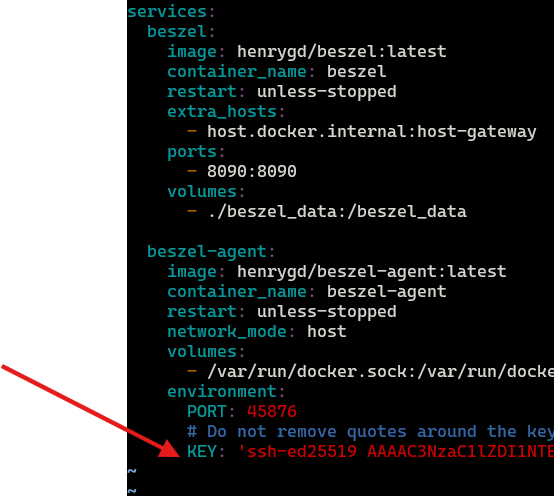
Back in your compose.yml for Beszel, add the ssh key to the KEY
Step 3 : Finish setting up the hub#
Back on your web browser, fill in the name (can be any name). But, the Host/IP must be host.docker.internal
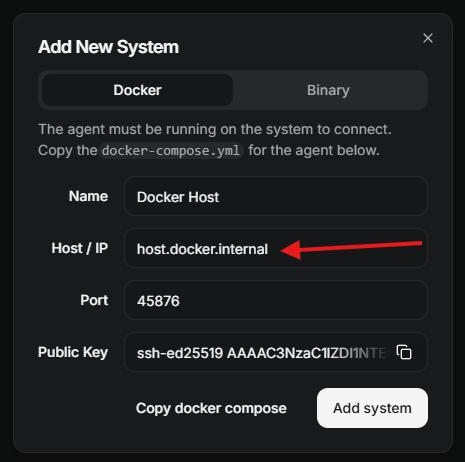
And click Add system
And that should be it!! You should be able to see the dashboard right away!
Step 4 : (Optional) Adding another system#
To add a new system, go to your new instance you want to monitor
mkdir beszel-agent
cd beszel-agent
And create the agent compose.yml
services:
  beszel-agent:
    image: henrygd/beszel-agent
    container_name: beszel-agent
    restart: unless-stopped
    network_mode: host
    volumes:
      - /var/run/docker.sock:/var/run/docker.sock:ro
      # monitor other disks / partitions by mounting a folder in /extra-filesystems
      # - /mnt/disk1/.beszel:/extra-filesystems/disk1:ro
    environment:
      PORT: 45876
      KEY: '<public key>'
Now, back in Beszel dashboard, click on Add System (Top right) and
- fill in the details
- Name: Can be anything
- Host/IP : Ip address of the instance where Agent is running
- Copy the ssh public key
- Update the key in the
KEYfor the new agent’scompose.yml(the one we just created) - Do
docker-compose up -dagain on the new agent
About Firewall rules#
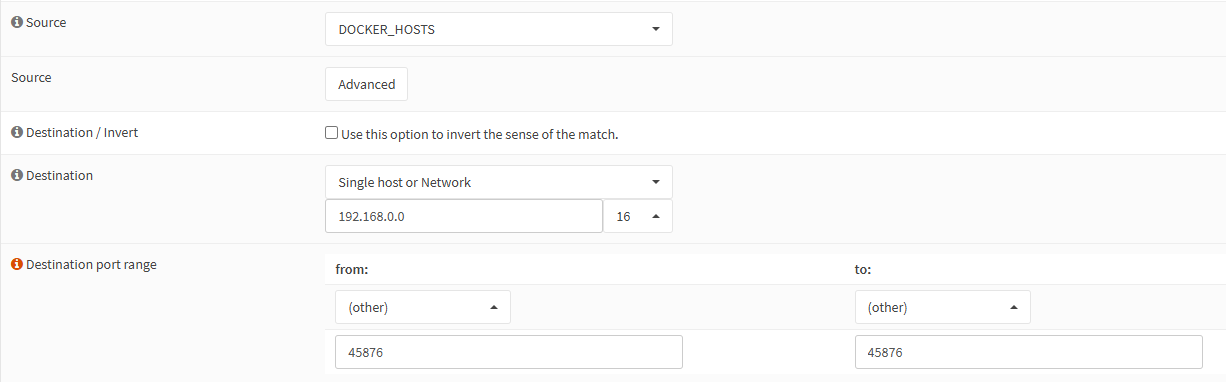
The Hub is connecting to the agent. So if your network has firewall restrictions, you must allow the Hub to connect to any agent you wish to monitor over port 45876
For example, this is my firewall rule allowing DOCKER_HOSTS which is where Beszel hub is running
Closing thoughts#
If you face any issues, take a look here